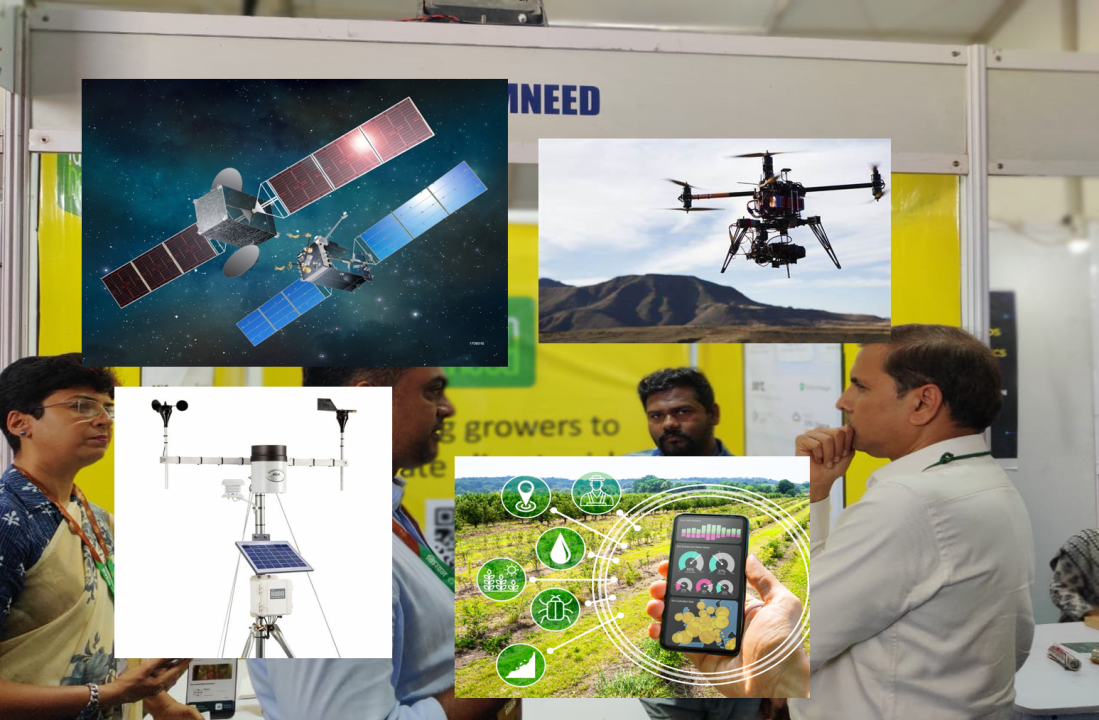
Climate Smart Agriculture has seen leveraging various technologies – Satellite imaging, weather data, machine learning, artificial intelligence, mathematical modelling, statistical methods etc. to bring in some predictiveness to agriculture. In last couple of years, I have been interacting with various players in the field including Fasal, Hydenmet, Mapmycrop, Farmneed, Agricolus, Onesoil, Davis Instruments, Earth Network, Bhoomitra and many other players to get some hang of the solution. Some of them were also present at KISAN 2022 allowing a physical interaction.
I hope this compilation simplifies the subject for broad understanding of people without much technical jargon.
A. The Data Feeds [Different Solution Providers use different set of data and approaches]
B. Machine Learning and Predictive Engine building
Crop Productivity is dependent on Plant Health [stage of the plant, vegetative index, leaf area index and chlorophyll level], Water condition [leaf moisture, soil moisture] and Climatic Conditions [GDD or Growing Degree Days, humidity, rains, temperature difference etc]. Add to this the other variable like crop, seed variety, soil type, soil fertility, crop practices, method of irrigation, and other local factors.
Building up a mathematical model based on these parameters and making prediction on possible biotic and abiotic stress is at the core of this model.
The model starts with historical understanding and a base model. As more data starts getting accumulated the machine learning starts improving. It learns both from the successful and failed predictions just like human intelligence. An AI model may come into play after that.
From the fundamental Indexes the efforts are on to develop secondary indexes like Disease-Water Stress Index.
Accuracy of the images as well as the quality of the mathematical model will determine the outcome.
C. Complementing Mathematical Model
Manual Scouting, Pest/Disease outbreak data are important for the model to take corrective measures.
I see these companies have really worked hard to make a reasonably powerful engine to give some guidance and help the decision taking. Expecting a 100% reliable outcome from the engine is not very realistic. We have to remember we are dealing with life science and probability.
There are many questions to ponder over this approach.
Does it fit for small land holding (say less than 20-30 Acres)? Do we need symptomatic granular approach, or do we move to a more holistic approach? Is it oversell of technology, or will it accrue the benefits? Is the model able to map so many varieties of crops?
Leaving that discussion for some other time. For now, let us appreciate the tenacity and commitment of so many engineers, scientists, entrepreneurs, academia and others to bring it to this stage. Anyone would be proud of the accomplishment and rightly so.
List of various indexes used in the process.
Group 1: Measuring the Vegetative Vibrancy. Different Indexes are evolved version of the primary NDVI index. Gives a broad idea of the green cover.
NDVI (Normalised Difference Vegetation Index), EVI (Enhanced Vegetation Index), SAVI (Soil Adjusted Vegetative Index), GNDVI (Green-NDVI), WDRVI (Wide Dynamic Range Vegetative Index), OSAVI (Optimized Soil Adjusted Vegetative Index)
Group 2: Qualitative analysis of the Vegetation through Chlorophyll measurement and Leaf Area Index. Both of them combine together to understand the photosynthesis potential of the capability of the plant to produce food.
RCI (Red Chlorophyll Index) TCARI (Transformed Chlorophyll Absorption Reflectance Index), LAI (Leaf Area Index)
Group 3: Moisture and Water availability measurement to identify soil moisture, drought situation, flooding or presence of water bodies.
NDMI (Normalised Difference Moisture Index), NMDI (Normalised Multiband Drought Index), NDWI(Normalised Difference Water Index). DWSI(Disease-Water Stress Index)
Group 4: A derivative of all three groups mapped for particular crop & stage to give a susceptibility of the plant to disease attack or water stress. Look for more such Indexes being developed as the technology progresses.
Group 5: Drone image and image processing for identification of various aspects of plant health as well as pest & disease incidences. Essentially this can enable a targeted spray (with geo location tagged by the inspection drone) by a second drone.
Essentially there are four layers:
LAYER 1 is getting the data & indices.
LAYER 2 is to have field data of the CROP, stage of the CROP and other relevant information. Layer 1 data has to be re-calibrated & calculated based on this data.
LAYER 3 is to now get the weather data – both the recent events as well as projected events. Interpret the data and probabilities based that.
LAYER 4 is to then map the relevant advisories and give advice to the farmers. In some cases it can directly instruct the robots/drones/automation to execute the action. This can also lead to yield estimation etc.
After a few years we shall get the answers to the following questions:
1. Will AI help make the predictions more accurate. Specially, as we even don’t know the number of variables we are chasing?
2. Will it be cost viable to deploy so much micro level monitoring & intervention in Agriculture?
3. Will we discover that holistic approach of a balanced farming practices is the apt approach instead of such reactive advisory?
Let’s see how the future unfolds.
There was this interesting discussion I had with Mr Prateek
The teaser of Self Running Soil Revolution for an investment
The effectiveness of any microbial product depends not just on
Mitrasena (Army of friends) is global brand of Biowall Agrihealth Pvt Ltd. Mitrasena products & protocols enables seamless transition to non-toxic farming by concurrently offering Excellent Protection, Higher Productivity & Profit and, Ease of use.
We are a DIPP recognized Startup working for non-toxic crop protection. We are driven by a highly passionate and professionally competent team.
MitraSena © 2025 | All rights reserved | Innovatively Designed and Built by Social Mukul Media
Have any query about bulk orders? Get in touch with us.